
In business why wouldn’t you measure your performance against your peers and against relevant industry sector data?
Last month we talked about customer satisfaction surveying and the Net Promotor Score; this month we are looking more specifically at the health of manufacturing sector in the US and the orders obtained for manufacturing technology (largely metal cutting machine tools).
At Wenzel we watch the PMI (Purchasing Managers Index) and the USMTO (United States Manufacturing Technology Orders) numbers and compare them with our own performance.

The Purchasing Managers’ Index (PMI) is an indicator of the economic health of the manufacturing sector. The PMI is based on five major indicators: new orders, inventory levels, production, supplier deliveries and the employment environment. These current indicators are analyzed but somehow it gives us a view into the future, through the eyes of purchasing managers, as to how confident they are about ordering equipment because of the growth they foresee.
An index of 50 represents a stagnant market, anything above 50 a growing sector
and anything below 50 a contracting sector.

USMTO is managed by AMT, The Association For Manufacturing Technology. Members of the USMTO provide order acquisition data each month and this information is then compiled into a report showing the orders placed in 5 different regions of the USA. This data normally takes a process time of 2 months so unlike the PMI index, the USMTO data is looking back into recent history a little more.
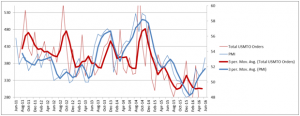
I believe that both measures above give an excellent snapshot as to the health of the  manufacturing sector in the US, one being slightly more forward looking and the other slightly more retrospective. Having said this if we plot both measures on top of one another we can see a very high degree of correlation, which would give me some confidence that both measures are tracking the same thing and with a high degree of agreement about the state of the US manufacturing economy.
Comparison of USMTO and PMI data over the last 5 years.
So what do these measures tell us about the state of manufacturing or perhaps more precisely manufacturing investment (even more significant for vendors!)?
• USMTO order for May 2016 were 18.2% down on May 2015 and April and May’s orders were the lowest for 5 years
• There has been a slow downward trend in orders since the ‘boom’ of 2010
• PMI in June was 53.2 – an average for the last 5 years, but a great deal healthier than in Q4 2015 and January 2016 where the index was below 50 for 4 months running.
So not good news on the whole.
The upcoming IMTS show in Chicago should help stimulate new business. See the USMTO national figures plotted below and look at the peaks of September 2012 and 2014. These peaks coincide with the IMTS show and experts at AMT see no reason why IMTS will not have the same stimulus this year.
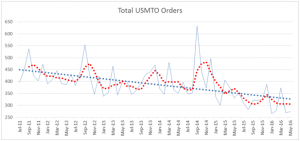
Also click below to listen to Pat McGibbon, VP of Strategic Analytics of AMT, talking about the May orders report. The folks at AMT (USMTO) believe that the decline is slowing and by the time IMTS comes around we will see some growth and a strong finish to the year.
All of the five regions are down this year when compared to a 4 year average.
- The NE region is down in real numbers but its share of US consumption has increased from 17% to 20%.
- The SE has seen a 15% decline in 2016 but its share has also increased from 10 to 12%.
- The West region has declined the least (just 6.5%) and has increased its share from 15% to 18% this year.
- The North Central (The mid-west rust belt!) is split into two, east and west, but together they account for 45% of the US machine tool consumption. This percentage has held in 2016 but orders are down around 15% compared to the 4 year average.
- The region hit most hard, presumably due to the oil price affecting investment in Texas is the South Central region. Orders in 2016 are less than a third of the 4 year average and its percentage share has dropped from 12 to 6% of total consumption.
So, in summary all regions are down with some worse than others.
As Pat pointed out in the AMT video some industries are still doing well. So for us vendors it makes sense to focus on the industries that are doing well like Aerospace, medical, guns and general engineering. It’s also good to note that others which have recently been hit hard show signs of improvement such as agricultural machinery.
So here’s my summary of what going on in the manufacturing sector and how it is affecting manufacturing technology or machine tool sales;
- Following the boom of 2011, orders have consistently fallen to a level around 23% lower than 2011’s peak consumption.
- AMT are forecasting and improvement and double digit sales growth in Q4 of 2016 and 2017.
- IMTS we hope will have its normal positive effect
- The recent jump in PMI tends to support this optimism in the AMT/USMTO forecast
- We are hopefully at the bottom of the slump right now – things can only get better!