
by Andy Woodward
How can USMTO Reports help drive sales and your bottom line?
The United States Manufacturing Technology Orders (USMTO) data report is compiled monthly by the Association for Manufacturing Technology (AMT).

Who is Association for Manufacturing Technology (AMT)?
If you attended or exhibited at the International Manufacturing Technology Show (aka IMTS – gotta love all these acronyms!), then you know AMT. They’re the folks that put that on every two years.
The Association’s stated purpose is to promote US-based manufacturing technology and its members—the companies who design, build, sell, and service that manufacturing technology.
Based in Virginia, AMT was founded in 1902 and specializes in providing targeted business assistance, extensive global support, and business intelligence systems and analysis to its members and industry as a whole. They communicate the importance of policies and programs that encourage research, innovation, and the development of educational initiatives to create future manufacturing technologists.
What is the USMTO data report?
The United States Manufacturing Technology Orders data report is compiled by AMT on a monthly basis and is based on the totals of actual data reported by companies participating in the USMTO program (about 200 as of 2013).
The full data set is reported by eligible equipment builders and distributors and is provided to all participants in the program at no cost.
Why we use the USMTO data reports
AMT also release much of the most important data in the reports publicly on their website and in press releases for the whole industry. So, anyone can access most of the relevant right online.
We find it really helpful for Wenzel America to track our sales performance against industry measures like the USMTO data.
The reports are also an interesting measure of how well US manufacturing, as a whole, is performing and shows us geographically where the largest equipment buyers are located across the United States.
What the reports tell us
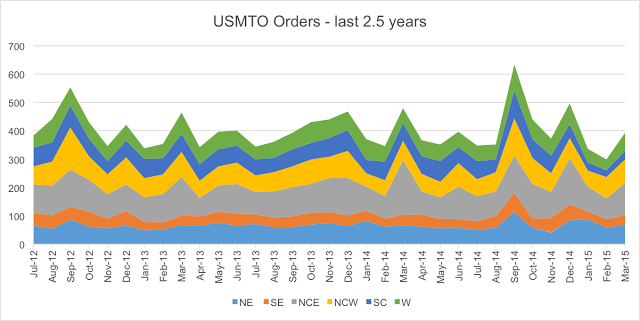
So, onto the data – the monthly totals are reported in millions of dollars.
The average orders received by the participant companies are about $409 million per month over the last 4 years.
Now, let’s look at the sales data in the last 4 years and see how that fits into the trends for the previous 15 years in the graph below. As we all remember recovery was in full swing in 2011, but since then we see a slow downward trend in equipment sales.
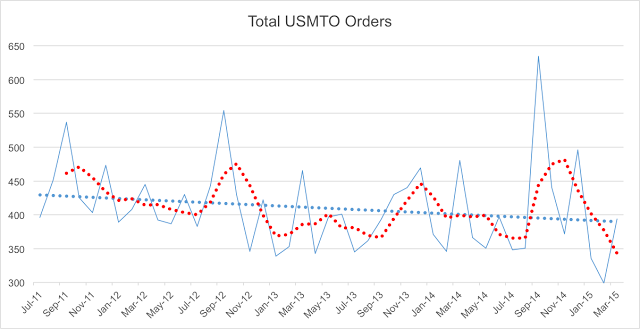
We can also see a seasonal variation and some notable spikes in over all machine orders.
If you look at the data even more closely, you can see pretty big spikes in September 2012 and September 2014 – Those were the months of the IMTS show in Chicago.
Maybe, the “reports of death of the trade show” have been a bit premature. Obviously, a lot of manufacturing equipment buyers wait for the show before committing to purchase and of course a lot of orders are set up to be taken at the show as well!
Representing that same data in quarters rather than months also shows us some interesting patterns:
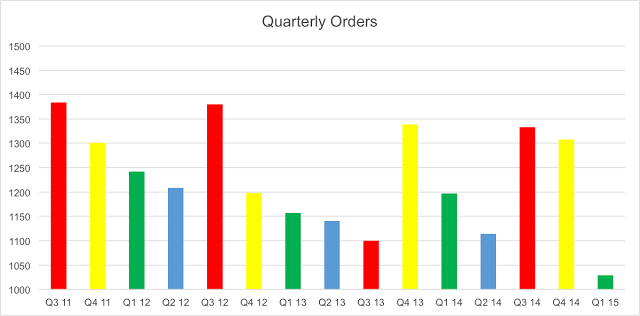
Q3 in 2012 and 2014 are bolstered by IMTS numbers in the September as we saw in the previous graph, but apart from 2012 we always see a strong Q4.
Most manufacturers and manufacturing equipment buyers have budgets that end in December and it would seem that many either wait until the last minute to spend their budgets, or they may purchase ahead of need to burn budgets, so as not to lose them – kind of like the flex-spending health accounts that send everyone to get dental work or eyeglasses in December.
Q1 and Q2 seem to be the traditionally slower quarters.
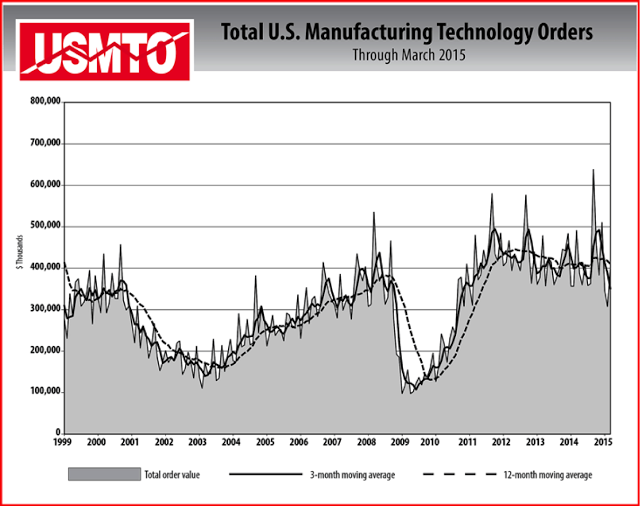
How does $400,000,000 per month equipment sales compare to the last 15 years?
If you look at where we’re at right now, the current average of $409 million in monthly sales is pretty healthy even looking at 15-year trends. But, the effects the last two recessions had on technology and machine tools sales were pretty dramatic as you can see below:
A glance back to get some perspective and focus ahead on the future
At the trough of the recessions in 2003 and 2009, only $100 million worth of equipment were being purchased.
This obviously shows how deep and terrible the recessions were, not only for US manufacturers, but for the sellers of manufacturing equipment and machine tools as well.
We can also see that the ‘shape’ of the last two recessions was very different. According to our USMTO data the 2003 recession really started in 2001 and didn’t really end until 2005 or even 2006. It was, however, slower in and slower out. So, its effects were probably a little easier to handle than the deep, sharp recession of 2009.
Sales peaked in early 2008 at over 500 million a month and were over $450 until mid-2008 and then plunge down to $100 million in just two months! You could say that was “shock and awe” for the manufacturing and machine tool equipment builders and distributors.
US Manufacturing equipment and machine tool sales at all time highs
Looking at the over $400 million monthly average sales for US-based companies shows a pretty healthy situation, especially compared to just five years ago, but it gets even better when you realize the right side of the graph shows four years of steady growth in manufacturing equipment and machine tools and at a higher average than any time in this century, even before the recession! That’s good news for all of us.
What does the USMTO data show from geographical perspective?
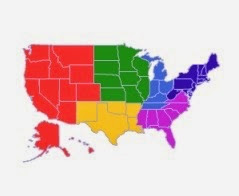
USMTO breaks the US into 5 regions:
- North East (NE)
- South East (SE)
- North Central East (NCE)
- North Central West (NCW)
- South Central (SC)
- West (W) as per the map here:
Some questions we can ask
Are Midwest fact,aditionally the industriaand of America, bum manufacturing equipment? Arerories in the Southeast buying more? Or the dot coms out West?
So much for “rust belt” states.
Call them what you want, but based on the NEW manufacturing equipment purchasing, a lot of Midwestern factories are looking pretty shiny and not rusty at all.
The last 32 monthly reports from USMTO, show that the Midwest (NCE and NCW) buys, on average, 44% of the nation’s manufacturing technology equipment with 26% from NCE’s five states of Michigan, Ohio, Indiana, Kentucky and Tennessee.
The share in the 5 regions hasn’t changed much, apart from a sharp decline in South Central in the last few months, presumably caused by the uncertainty surrounding the oil prices in Texas.
Our three biggest takeaways from USMTO data reports
- The last 4 years of manufacturing equipment sales growth show that US manufacturing is doing well and companies are investing in new technology and machine tools.
- When we have a recession it is extremely painful for the manufacturing sector, but perhaps even more painful for producers and sellers of manufacturing technology and machine tools.
- Midwestern industry (particularly Michigan, Ohio, Indiana, Kentucky and Tennessee) is still the largest consumer of machine tools and manufacturing technology.
Thanks to the AMT and USMTO for the use of their data.
Sources:
- The Association for Manufacturing Technology (AMT)http://www.amtonline.org
- U.S. Manufacturing Technology Orders (USMTO)https://www.usmto.com