
Have you ever wanted to chase those last couple of microns? If you are reading this, it might be your daily job and so you could well find this useful.
What may not be part of your current tool belt (read: know-how) when using your metrology software is the filtering tools available at your disposal. What you may also not know is how exactly they function. By breaking it down to simple analogies, it might be easier than you think.

When talking about filtering, we can compare this very much to music where you have high frequencies (the flutes and piccolos), medium frequencies (the trumpets), and low frequencies (the tubas). Similarly, with data gathered from a circle, for example, you will have high frequencies (the roughness), medium frequencies (Maybe machine vibration), and low frequencies (overtightened chucks). Mainly we are interested in the low frequency deviations when it comes to data which means that we have to choose a filter that will allow us to see mainly these low frequency deviations. The most common name used in metrology software is the Low pass filter type.
When I talk about these frequency deviations, we can represent these as harmonics in a harmonic spectrum so you can have a first order harmonic, second order harmonic, third… etc. all the way to infinity. This is represented by the black box in the picture above. So we could say that harmonics 1-50 are the low frequency harmonics, 50-200 are the medium frequency harmonics, and 200-infinity are the high frequency harmonics. This means that we are mainly interested in seeing the harmonics 1-50 in our circle (the tubas) and we are not as interested in the higher frequencies (the flutes and piccolos). This is inherently what a CMM is for – looking at low frequency deviations. For roughness, we have specialized roundness machines. For this, I refer you to Dr. Mark Malburg’s Digital Metrology blog post from June of 2014 which will really help clarify these concepts (http://digitalmetrology.com/2014/06/). I also recommend looking at his other blog posts which are very very informative regarding understanding the concepts of filtering (as well as roughness which is what he specializes in).
If you were to make a circle that was mainly composed of the second harmonic, the more pronounced this is, the more “oval-ish” the circle would look. By the same token, if you were to make a circle that was mainly composed of the third harmonic, the more pronounced this is, the more “trilobe-ish” the circle becomes (this is what happens to the part when a three-jaw chuck is overtightened). Thus, we can mathematically split any data set into its harmonics using what is called a fast-Fourier transform (FFT).
This brings us to what some softwares refer to as the filter method. The short answer is that for closed features (circles, cylinders, etc.), the UPR (Undulations Per Revolution) method should be chosen. For open features (planes, lines, etc.), you should choose the wavelength cutoff method. The longer answer is that the UPR method sets what the cutoff UPR is and the wavelength cutoff method sets what the cutoff wavelength (denoted by the Greek letter Lambda) is.
 These are both analogous to what harmonic you are choosing. For UPR, you can think of this as choosing directly the harmonic so 50 UPR = 50th harmonic (see http://digitalmetrology.com/2018/06/). For the cutoff wavelength, you will be choosing a value in millimeters which indicates the size/length of the function which will be applied at every point (more on this below).
Just for your information, if we were to choose a high pass filter type, then we would choose a harmonic where we want to see that harmonic and the harmonics higher than that (we want to hear the flutes and piccolos). If your software allows it, with a band pass filter type, we should be able to choose TWO harmonics so that we can see the harmonics in between these TWO harmonics and not so much the high and low harmonics (we want to hear the trumpets). However, as I mentioned, we are mainly interested in looking at the low frequency deviations so make sure to keep your filter type at low pass.
For these next explanations, I will assume that we are using a low pass filter type. It is then easy to see how with CIRCULAR features, the HIGHER the UPR we choose, the more harmonics we “keep”, so the data should not be “filtered” very much. We are saying that we want to hear everything (flutes/piccolos, trumpets, and tubas). However, if we choose, for example, 50 UPR, then we only want to hear the tubas. In conclusion, with a low pass filter type, and with UPR, the LOWER the UPR, then the MORE FILTERED (smooth) the data will look.
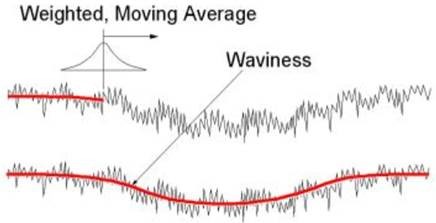
With cutoff wavelength, it is the inverse. With a cutoff wavelength, what you are choosing is the size of the Gaussian passive filter that will be applied to every data point. This means that if you choose a HIGHER cutoff wavelength, then the Gaussian filter will be larger/longer, and every point will be “smoothed” more (because we are averaging over a lot of points), and so the MORE FILTERED (smooth) the data will look.
I say “Gaussian passive filter” because this is the most commonly used algorithm because this is the most common but your software might allow for other functions to be applied.
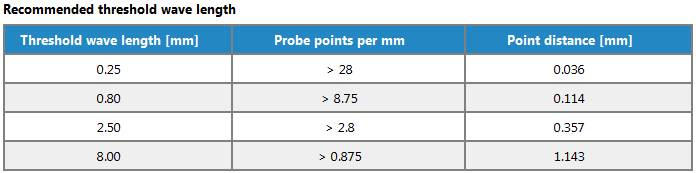
Also, there is the matter of WHEN to apply filters and WHICH filters to apply. This will mainly depend on the size of the part. For example, if you have a really large circle, then you can allow higher UPRs because since it is physically larger, our limit for what is considered a “low wavelength” should be higher. Conversely, a small circle should have a smaller UPR because our limit for what is considered a “low wavelength” should be lower. Please refer to the following charts from our Quartis software for suggestions as to when to apply a filter. For clarification, when the chart refers to Waves per circumference (W/U), it is analogous to Undulations Per Revolution (UPR).
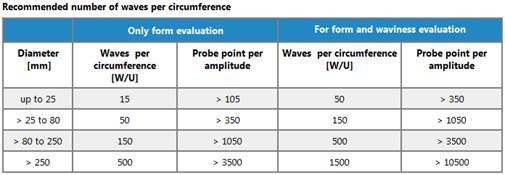
Finally (if I haven’t confused you already!), there is the matter of how many points to take when filtering. Filtering is, by nature, a high point density function. As you’ll notice in the chart above, for every UPR you will need a minimum of 7 points. So, if you would like to apply a filter for a circle with 50 UPR, you will need at least 350 points. Otherwise, many softwares just won’t apply the filter.
If you are interested in talking about filters with me more, please don’t hesitate to contact me here. Also, don’t forget to check out our website here and our YouTube channel here. Lastly, make sure to follow me for the latest in metrology on Twitter @WenzelCore. Happy measuring and Happy Thanksgiving!